
(this is an edit to clarify a few points that were confusing previously)
Recently when I was looking for an objective way to numerically describe how good Engelb Vielma's glove for my Minnesota Twins' top 40 prospect list, which is fairly easily understood as a concept, I came up with a simple metric: The percentage of putouts that resulted in a double play. I did a bit of research to see whether it will pass the stink test, and looked at Omar Visquel's (who is indisputably a good glove shortstop and pretty recent) gold glove seasons (1994-2001). Visquel percentage of putouts that were double plays was 40%, so I concluded that Vielma's 39.6 was indeed encouraging. Furthermore I used this metric (as supportive to what I have seen with my eyes this season) to suggest that Jose Polanco, whose 52.3% of Put Outs were Double Plays, despite the rumors, is a very good shortstop with the glove. This resulted in a major upset on the top 10 of my Twins' prospect list, and a hearty discussion of the metric, among other things, here.
Conceptually it is very simple metric: An effective shortstop will turn as many outs as possible when he has a chance. It is affected by many things like range and arm, but it is not perfect. It misses the number of chances for double play as a normalization, and something to describe how the shortstop was with the glove when there were no putouts. So I did three things :
a. When I first thought of this, I thought that putouts were the way to go, because for some reason helped tell more for a shortstop than assists. After a bit of discussion and noodling, this is not really valid. I was wrong to use putouts for the denomination. I think that Total Chances are a better denominator, so that is it. Instead of percent of Put Outs that were Double Plays, I am using percent of Chances that resulted in Double Plays (%CDP)
b. To add something in the measurement that describes a shortstop in a non-double play situation, I went back to an old (and tired) friend and gave it new life my marrying it with %CDP: Good old Fielding Percentage, which by itself is inadequate to whole describe fielding, but a very simple conceptual metric: Errors over chances. So this compound measurement is simply: The percent of Chances that resulted in Double Plays multiplied by Fielding Percentage. Because that is a mouthful, I am calling it Shortstop Fielding Effectiveness (SSFE, and the name is similar to the other metric I device to simply evaluate pitching, the Pitching Effectiveness.)
c. To normalize for the chances of double play (i.e. how many of total chances were with a man on base,) I normalized against the league for a full season, assuming that the chances for a double play are pretty much the same for all teams in the course of 2280 games (152 times 15) and a league normalization, would be good enough. So I calculated the average SSFE (which was 13.5) and divided each player's with that average, resulting to a normalized value, which I call nSSFE. nSSFE of 1 is average, everything above 1 is above average and everything below 1 is below average. To make it look numerically a bit more familiar (think ERA+ and OPS+,) I multiplied by 100 (making the average 100, like those other 2 metrics) creating what I call nSSFE+ (still a mouthful). 139 players played Shortstop in the bigs in 2014 contributing to those numbers.
Does it pass the stink test?
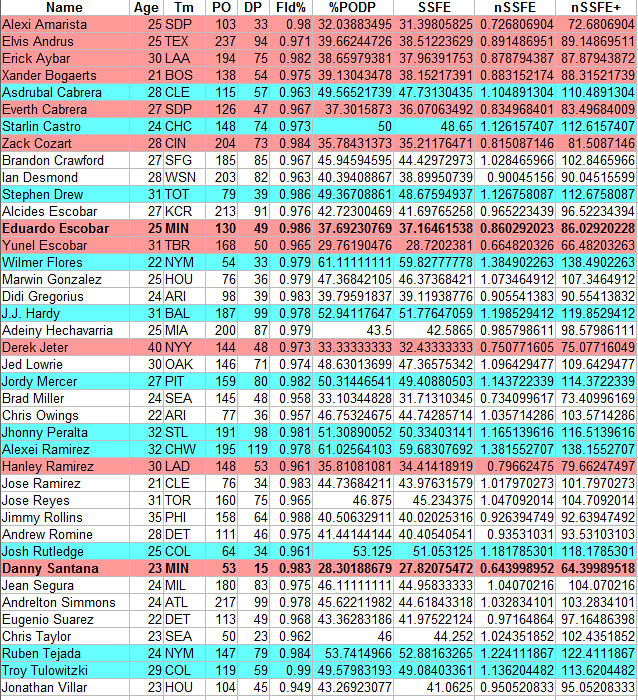
Here is the nSSFE+ are all MLB shortstops in 2014 with more that 200 innings at shortstop. In blue are the above average shortstops (nSSFE+ 110 or more) and in red are the below average (nSSFE+ 90 or less.) Since this is a Twins-focused blog, the Twins' players are in bold.
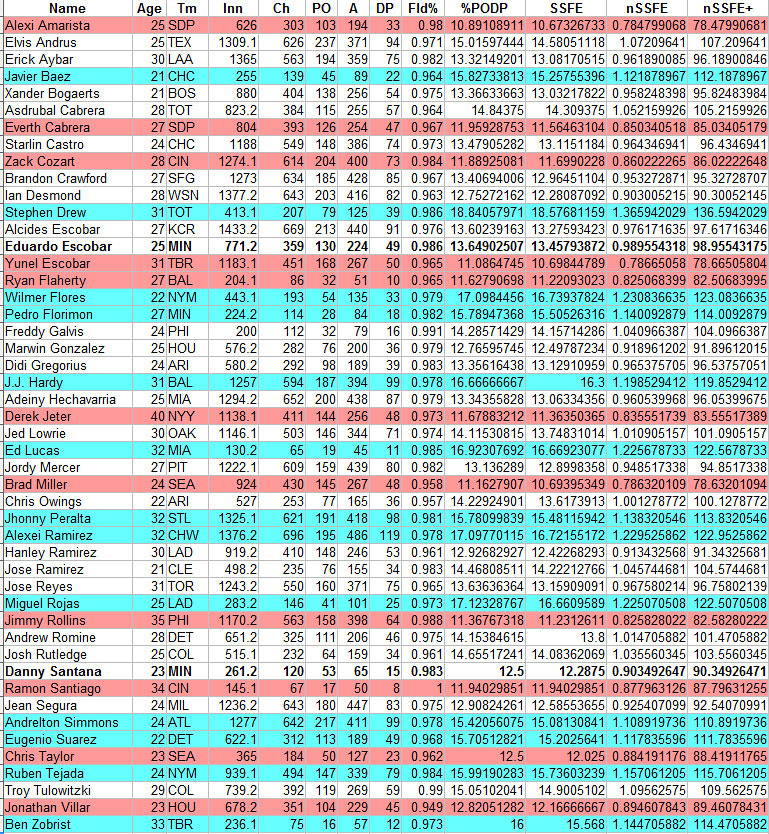
I think that it does pass the stink test if you look who is in the blue categories (JJ Hardy, S. Drew, et al) and who is in the red (Derek Jeter, Jimmy Rollins et al.)
Is it a perfect metric? No; because there is no such a thing. But I think that it is easily understood as a concept and can be valuable. And it is better than the "eye" alone. The two together may be awesome. Could it be translated to other positions? I will try to play around, but feel free to play and tell me :) I will eventually look to see how the average moves with history, and potentially refine it, but this is the first attempt...
Recently when I was looking for an objective way to numerically describe how good Engelb Vielma's glove for my Minnesota Twins' top 40 prospect list, which is fairly easily understood as a concept, I came up with a simple metric: The percentage of putouts that resulted in a double play. I did a bit of research to see whether it will pass the stink test, and looked at Omar Visquel's (who is indisputably a good glove shortstop and pretty recent) gold glove seasons (1994-2001). Visquel percentage of putouts that were double plays was 40%, so I concluded that Vielma's 39.6 was indeed encouraging. Furthermore I used this metric (as supportive to what I have seen with my eyes this season) to suggest that Jose Polanco, whose 52.3% of Put Outs were Double Plays, despite the rumors, is a very good shortstop with the glove. This resulted in a major upset on the top 10 of my Twins' prospect list, and a hearty discussion of the metric, among other things, here.
Conceptually it is very simple metric: An effective shortstop will turn as many outs as possible when he has a chance. It is affected by many things like range and arm, but it is not perfect. It misses the number of chances for double play as a normalization, and something to describe how the shortstop was with the glove when there were no putouts. So I did three things :
a. When I first thought of this, I thought that putouts were the way to go, because for some reason helped tell more for a shortstop than assists. After a bit of discussion and noodling, this is not really valid. I was wrong to use putouts for the denomination. I think that Total Chances are a better denominator, so that is it. Instead of percent of Put Outs that were Double Plays, I am using percent of Chances that resulted in Double Plays (%CDP)
b. To add something in the measurement that describes a shortstop in a non-double play situation, I went back to an old (and tired) friend and gave it new life my marrying it with %CDP: Good old Fielding Percentage, which by itself is inadequate to whole describe fielding, but a very simple conceptual metric: Errors over chances. So this compound measurement is simply: The percent of Chances that resulted in Double Plays multiplied by Fielding Percentage. Because that is a mouthful, I am calling it Shortstop Fielding Effectiveness (SSFE, and the name is similar to the other metric I device to simply evaluate pitching, the Pitching Effectiveness.)
c. To normalize for the chances of double play (i.e. how many of total chances were with a man on base,) I normalized against the league for a full season, assuming that the chances for a double play are pretty much the same for all teams in the course of 2280 games (152 times 15) and a league normalization, would be good enough. So I calculated the average SSFE (which was 13.5) and divided each player's with that average, resulting to a normalized value, which I call nSSFE. nSSFE of 1 is average, everything above 1 is above average and everything below 1 is below average. To make it look numerically a bit more familiar (think ERA+ and OPS+,) I multiplied by 100 (making the average 100, like those other 2 metrics) creating what I call nSSFE+ (still a mouthful). 139 players played Shortstop in the bigs in 2014 contributing to those numbers.
Does it pass the stink test?
Here is the nSSFE+ are all MLB shortstops in 2014 with more that 200 innings at shortstop. In blue are the above average shortstops (nSSFE+ 110 or more) and in red are the below average (nSSFE+ 90 or less.) Since this is a Twins-focused blog, the Twins' players are in bold.
I think that it does pass the stink test if you look who is in the blue categories (JJ Hardy, S. Drew, et al) and who is in the red (Derek Jeter, Jimmy Rollins et al.)
Is it a perfect metric? No; because there is no such a thing. But I think that it is easily understood as a concept and can be valuable. And it is better than the "eye" alone. The two together may be awesome. Could it be translated to other positions? I will try to play around, but feel free to play and tell me :) I will eventually look to see how the average moves with history, and potentially refine it, but this is the first attempt...


2 comments:
Interesting and hard work. I am having difficulty understanding the logic behind the underlying premise, to wit, the % of putouts resulting in a double play indicates fielding prowess. Care to explain reasoning again/further?
Thanks for your hard work,
Minderbinder
The numerator is double plays, so this assumes, that a shortstop who turns more double plays has a higher fielding prowess than one who turns fewer, because he has better range and or a stronger arm. The denominator, is a "container" (box, bucket) that further refines that numerator. Originally, I thought that putouts was a better denominator, but now I think that chances, are; so I revised the metric to calculate % of Chances that turned into double plays. So this assumes that a player that turns 4 double plays every 10 times that he touches (or should have touched) the ball, is better than a player who turns 2. This assumes that the ability to turn a double play more frequently indicates a better fielder... This is what the measurement is about. Further refined by the league average to account for rate of chances to even turn a double play and Further refined by fielding percentage to look at the balls that someone should have handled even in a non-double play situation.
Does that make any sense now? :)
Post a Comment